+1.585.321.5800
NTP Status Monitoring
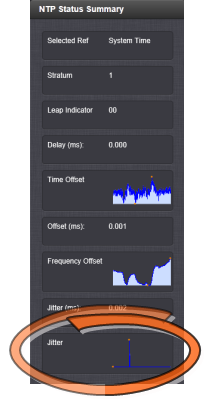
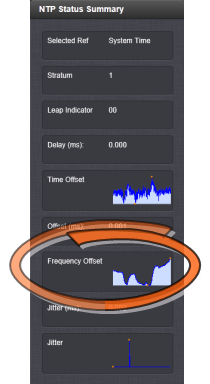
SecureSync's NTP Status Summary provides a means to monitor NTP status and performance parameters relevant to your SecureSync at a glance.
- To access the NTP Status Summary panel, navigate to MANAGEMENT > NETWORK: NTP Setup.
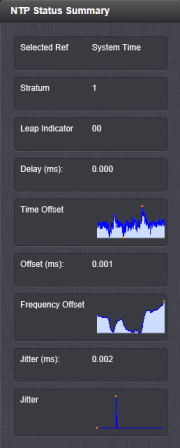
- The NTP Status Summary panel is at the lower left of the screen. The panel contains the following information:
- Selected Ref—The reference SecureSync is currently using.
- Stratum—This is the stratum level at which SecureSync is operating.
- Leap Indicator—The leap indicator bits (usually 00). See Leap Second Alert Notification.
- Delay (ms)—The measured one-way delay between SecureSync and its selected reference.
- Time Offset—This is a graphical representation of the system time offset over time. Clicking on this graph in the NTP Status Summary panel will open a window in the main panel containing a larger, more detailed view of the graph. See The NTP Time Offset Performance Graph.
- Offset (ms)—Displays the configured 1PPS offset values.
- Frequency Offset—This is a graphical representation of the system frequency offset over time. Clicking on this graph in the NTP Status Summary panel will open a window in the main panel containing a larger, more detailed view of the graph. See The NTP Frequency Offset Performance Graph.
- Jitter (ms)—Variance (in milliseconds) occurring in the reference input time (from one poll to the next).
- Jitter—This is a graphical representation of the system jitter over time. Clicking on this graph in the NTP Status Summary panel will open a window in the main panel containing a larger, more detailed view of the graph. See The NTP Jitter Performance Graph.
Note: This panel is updated every 30 seconds, or upon clicking the browser refresh button.
To view the NTP Time Offset performance graph:
- Navigate to MANAGEMENT > NETWORK: NTP Setup.
- In the NTP Status Summary panel locate the Time Offset graph.
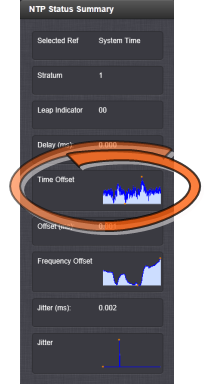
- Click the graph in the NTP Status Summary panel.
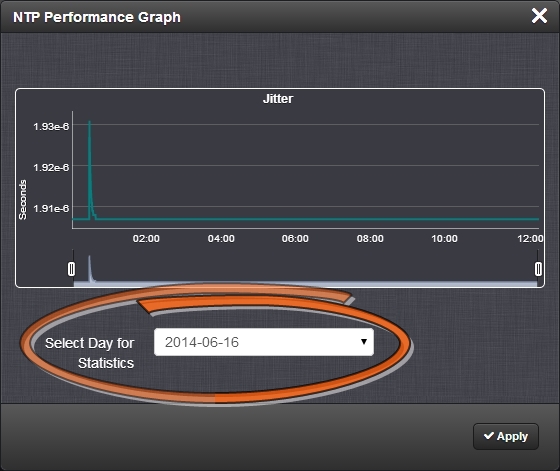
- The NTP Performance Graph panel will appear.
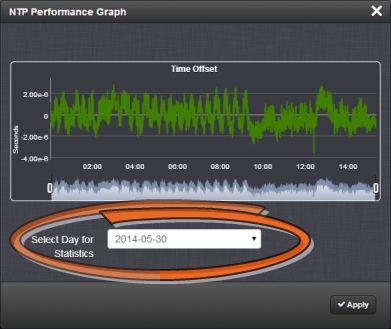
- To select the statistics for a particular day, select a date from the drop-down list in the Select Day for Statistics field. The default date is the present date. Click Apply.
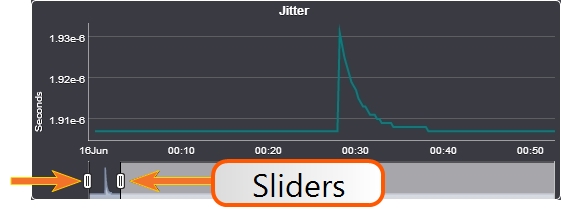
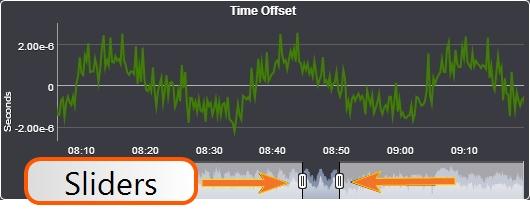
- To display a higher resolution graph for a shorter time span, move one or both time sliders at the bottom of the graph inwards.
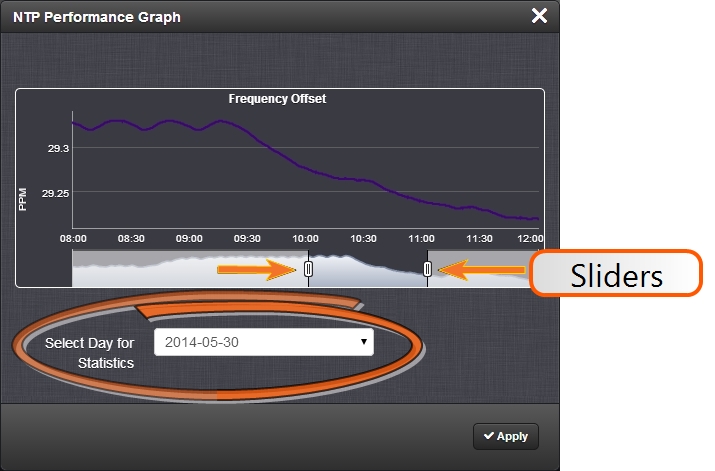
To view the NTP Frequency Offset performance graph:
- Navigate to MANAGEMENT > NETWORK: NTP Setup.
- In the NTP Status Summary panel locate the Frequency Offset graph.
- Click the graph in the NTP Status Summary panel.
- The NTP Performance Graph panel will appear (the data may be displayed with a delay). The X-axis represents time, the Y-axis shows the frequency offset in parts-per-million (PPM); e.g. 290 PPM is equivalent to .0290 percent.
- To select the statistics for a particular day, select a date from the drop-down list in the Select Day for Statistics field (highlighted in green in the illustration above). The default date is the present date. Click the Apply button.
- To display a higher resolution graph of a shorter time frame, move one or both of the two sliders inwards.
To view the NTP Jitter performance graph:
- Navigate to MANAGEMENT > NETWORK: NTP Setup screen.
- In the NTP Status Summary panel locate the Jitter graph.
- Click the graph in the NTP Status Summary panel.
- The NTP Performance Graph panel will appear.
- To select the statistics for a particular day, select a date from the drop-down list in the Select Day for Statistics field. The default date is the present date. Click the Apply button.
- To display a higher resolution graph for a shorter time span, move one or both time sliders at the bottom of the graph inwards.