Status Monitoring via the Web UI
- Time synchronization status, including references
- GNSS satellites currently being tracked
- NTP sync status and current Stratum level
- Estimated time errors
- Oscillator disciplining
- Temperature monitoring
The HOME screen provides time server status information, while the TOOLS > System Monitor screen also displays hardware status data, e.g. temperature curves:
Status Monitoring via the HOME Screen
The HOME screen of the VersaSync Web UI provides a system status overview (see also The Web UI HOME Screen).
The HOME screen is divided into four panels:
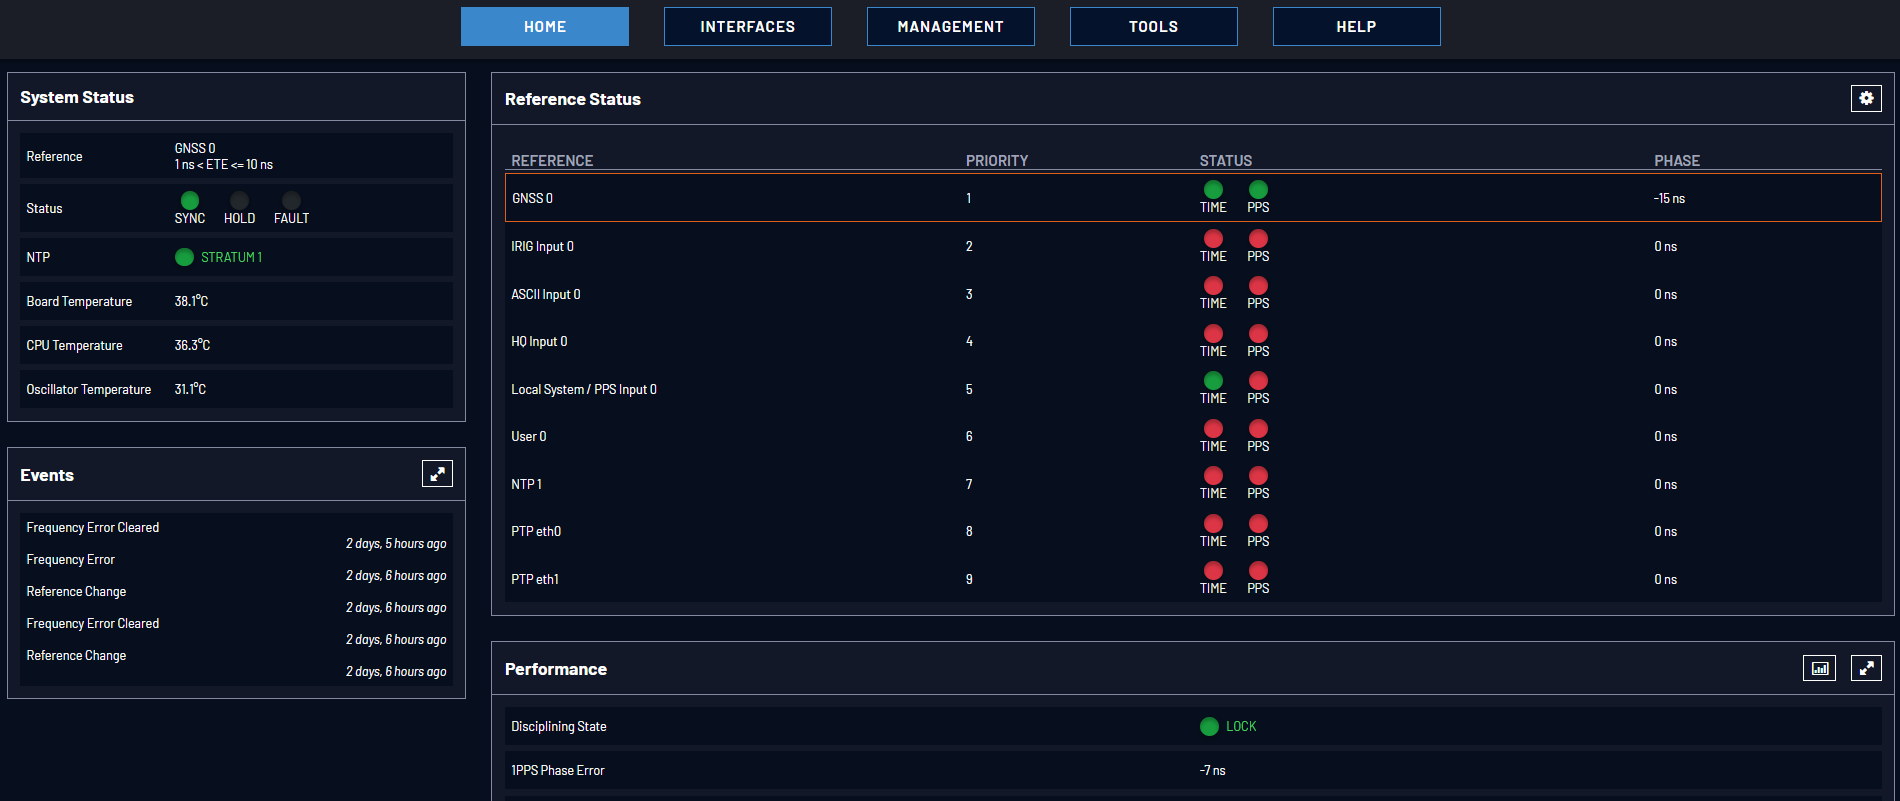
- Reference—Indicates the status of the current synchronizing reference, if any.
- Power—Indicates whether the power is on.
- Status—Indicates the status of the network’s timing. There are three indicators in the Status field:
- Sync—Indicates whether VersaSync is synchronized to its selected input references.
- Green indicates VersaSync is currently synchronized to its references.
- Orange indicates VersaSync is not currently synchronized to its references.
- Hold—When lit, VersaSync is in Holdover mode.
- Fault—Indicates a fault in the operation of the VersaSync. See Troubleshooting via Web UI Status Page for instructions for troubleshooting faults.
- Sync—Indicates whether VersaSync is synchronized to its selected input references.
- Alarm Status: If a major or minor alarm is present, it will be displayed here.
- NTP—Current STRATUM status of this VersaSync unit.
- Temperature—The current board temperature will be displayed here.
- REFERENCE: Indicates the name type of each reference. These are determined by the inputs set up for the VersaSync
- PRIORITY: Indicates the priority of each reference. This number will be between 1 and 15. References in this panel appear in their order of priority. See Configuring Input Reference Priorities for more information.
- STATUS: Indicates which available input reference is acting as the Time reference and which available input reference is acting as the 1PPS reference.
- Green indicates that the reference is present and has been declared valid.
- Orange indicates the input reference is not currently present or is not currently valid.
- Disciplining State—Indicates whether or not the internal oscillator is currently being disciplined (steered to an input reference).
- 1PPS Phase Error—An internal measurement (in nanoseconds) of the internal 1PPSs’ phase error with respect to the selected input reference (if the input reference has excessive jitter, phase error will be higher)
- 10 MHz Frequency Error—An internal estimated calculation (in Hertz) of the internal oscillator’s frequency error, based on the phase accuracy error at the beginning and end of a frequency measurement window (the length of this window will vary depending upon the type of oscillator installed and the oscillator adjustment algorithm).
The Events panel in the bottom-left corner of the HOME screen is a log of VersaSync’s recent activity. It updates in real time.
Note: If you know the individual reference or output whose status you wish to see, you can access the Status window of that reference or output directly through the INTERFACES > REFERENCES or INTERFACES > OUTPUTS drop-down menu.
Status Monitoring via the System Monitor Screen
To display status information pertaining mainly to VersaSync's current hardware status, navigate to TOOLS > SYSTEM > System Monitor.
The information provided on the System Monitor Screen is subdivided into three panels:
This is identical with the HOME screen System Status panel.
This panel displays:
- Total: [MB]
- Used: [MB]
- Free: [MB]
- Percent: [%]
The last item refers to system storage. If you need to update the System Software, and this number is 70% or higher, it is recommended to clear logs and stats in order to free up memory space. (Navigate to TOOLS > SYSTEM: Upgrade/Backup, and click the corresponding buttons in the lower left-hand corner.)
Graphs are displayed for:
- Board Temperature
- Memory Used
- CPU Used.
To delete the logged data used to generate the displayed graphs, click the TRASHCAN icon. (Note that re-populating the graphs with fresh data generated at a 1/min. rate will take several minutes.)
To download the logged data in .csv format, click the ARROW icon.